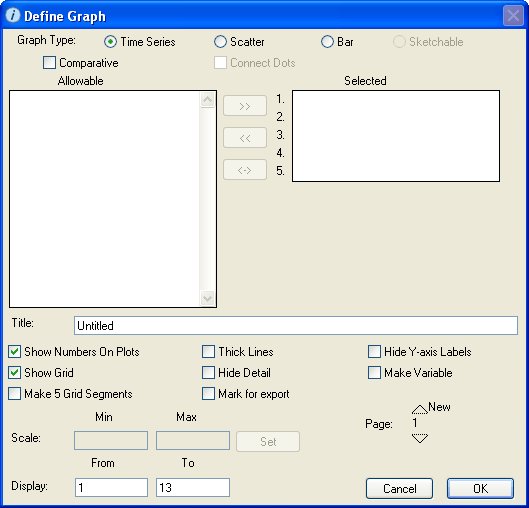
Use the Define Graph dialog box to view and edit the properties of the selected graph pad.
To open the Define Graph dialog box, double-click the open graph pad window (or right-click the open graph pad window and then choose Open from the menu that appears).
Note: You can also open this dialog box by clicking the Graph button in the Sensitivity Specs dialog box.

Select the type of graph you want to create. For each type
Scatter – Select this option to chart the values of one entity versus another, as these values change over time. When you select this option, you can select only two entities from the "Allowable" list (one entity per axis).
Tip: To have the plotted points connected in the generated graph, select the Connect Dots check box.
Select this check box to generate the selected graph type in comparative mode.
This option is often used in conjunction with sensitivity analysis. When comparative graphs are generated and sensitivity analysis is turned on, clicking the  button at the bottom of the Graph Pad window displays a journal of the most recent sensitivity setup used to create the graph.
Tip: Comparative graphs accumulate data. Periodically, you may wish to clear this data. To do so, click  at the bottom of the Graph Pad window or position the dynamite tool in the graph and click once. For more information about deleting data with the dynamite tool, see Dynamite operations.
Alternatively, you can clear the data from all graphs and tables at once by choosing Restore Graphs & Tables from the Model menu.
Note: If the Comparative check box is selected and you load a saved run, the comparative graph does not clear the historical data run or change to display vales from the loaded run.
Note: This check box is available only when you select the Scatter graph type option.
Select this check box to connect the plotted points in the generated scatter graph with a line.
Note: This check box is available only when you select the Sketchable graph type option.
Select this check box to allow model users to redraw an entire sketch while the simulation is running or during pauses in the simulation. If this check box is not selected, the model user can only redraw that portion of the graph that is beyond the current simulation time.
The Benchmark check box is selected by default when you select the Sketchable graph type option.
For more information about sketchable graphs, see To define a sketchable graph.
Displays a list of all entities in the model. Use this list to select the entities whose values you want to graph.
Note: The number of entities you can choose depends on the type of graph you are creating and whether it is a standard or comparative graph. You can choose up to five entities for a time series or bar graph, two entities for a scatter plot graph, and just one entity for a sketchable or a comparative graph.
Tip: You can also select entities for the graph by dragging and dropping a stock, flow, or converter icon on the Map or Model layer directly onto the graph pad icon or onto a pinned graph pad. When you view the Define Graph dialog box, the entities you selected via drag and drop appear in the "Selected" list.
Displays a list of the entities you selected from the "Allowable" list.
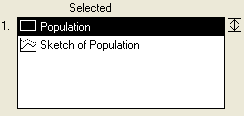
If you are creating a Sketchable graph, you can select only one entity. The "Selected" list displays the entity you selected along with an entry for the sketch of the selected entity. In the following example, "Population" is the selected stock and will appear as curve 1 in the graph, and "Sketch of Population" represents the user-defined sketch, which will appear as curve 2 in the graph.

Type the title for the current graph pad page. The title appears in the title bar of an unpinned pad and at the bottom of pinned and unpinned pads.The title appears at the bottom of the graph when you print a graph pad.
Note: This check box is available only when you select the Time Series or Sketchable graph type.
Select this check box to display the identifying number for each entity on its curve in the graph. (Numbers are assigned to each entity as you add the to the "Selected" list.) Showing identifying numbers on plots helps you easily identify which curve is generated from which entity.
This check box is selected by default when you choose a Time Series or Sketchable type graph.
Note: This check box is available only when you select the Time Series, Scatter, or Sketchable graph type.
Select this check box to display a grid on the background of the graph pad page. A grid can make it easier for users to determine numerical values on the plot.
This check box is selected by default.
Note: This check box is available only if the Show Grid check box is selected.
Select this check box to divide the X-axis into five uniform segments (versus the default four segments).
Note: This check box is available only for Time Series, Scatter, and Sketchable graphs. Lines appear for scatter graphs only when you select the Connect Dots option.
Select this check box to draw bold lines for the plotted curves.
Select this check box to hide the following items that are displayed by default on the graph pad: the date and time of the most recent simulation run, the dynamite icon  , the print icon
  , and the lock icon
  .
.
Select this check box to include the graph in a report generated by a button that has been assigned the Print Export command.
Select this check box to hide the graph's Y-axis labels.
Note: This check box is available only when you select the Sketchable graph type.
Select this check box to create a converter on the Map/Model layer that contains the data for the user-sketched curve.
This allows you to include the data from the sketched curve in a table, or to create a new entity that compares the sketched data with the actual data and that trigger's a message that reflects how close the sketched data are to the actual results.
Use the options in the "Scale" section to set the scale for any entity in the "Selected" list for the graph.
Note: If you do not set a scale, the software automatically sets one for you.
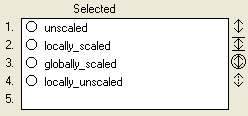
An icon appears to the right of each entity in the "Selected" list, indicating its scaling status:

Note: To globally set the scale for any entity, you can also use the Global scale option on the Scales and Ranges panel.
Note: These options are available only for the Time Series and Sketchable graph types.
Use the boxes in this section to display a portion of the data associated with a simulation run. This allows you to focus the graph on the values associated with a specific part of the simulation. The default display range is the entire simulation run (as defined in the From and To boxes in the Run Specs dialog box).
Note: The display range setting you specify is local to the current graph pad page only.
Use the Page option to add more pages to the pad and to navigate between existing pages to define them. Each page can display a different graph. You can create as many pages for the pad as you want.
To create a new page, click the New button.

The number under the New button changes to the next sequential number. Use the rest of the options in the dialog box to define the graph you want to display on the new page.
To move to the next or previous page, click the up or down arrow buttons. The number between the arrows indicates the page you are currently viewing.

You can edit the contents of the currently displayed page.
Notes: If you create more than one page for the graph pad, model users can use the page turner in the pad's lower-left corner to move from page to page. For more information, see To turn the page in a pad.
You can delete any page from a pad by using the dynamite tool. For more information, see To delete pages or data from a pad.